

Zig Zag Indicator: settings and strategies
The Zig Zag indicator is a technical analysis tool created by Art Merrill and John Mc Ginley of Technical Trends.
This indicator is mainly used to identify a trend by filtering the “secondary” price movements and highlighting the most significant ones.
The idea of the developers was to eliminate the so-called “background noise” that dirties many graphs and often does not make it easy to see the trend of the main trend.
A chart with active Zig Zag shows more clearly where prices are going, but not only that, as we will see, this indicator highlights many other things, which we will discuss in depth in this guide.
If you want to see the Zig Zag indicator in action, you can access the eToro Demo account or one of the commission-free Brokers listed below and test this tool in total safety.
| 👍Zig Zag Indicator : | Our Tips about it |
| 👌Reliability: | ⭐⭐⭐⭐⭐ |
| 💰Invest on the downside: | Find out Short Selling |
| 💻Best trading course: | ForexTB eBook |
| 🥇Best platforms: | eToro e ForexTB |
| 😢How to avoid scams : | Invest only with regulated platforms |

|
Platform: etoro Min. Deposit: 50€ License: Cysec |
|
|
|---|---|---|---|

|
Platform: xtb Min. Deposit: 100€ License: Cysec |
|
|

|
Platform: iqoption Min. Deposit: 50€ License: Cysec |
|
|

|
Platform: ubrokers Min. Deposit: 250€ License: Cysec |
|
|

|
Platform: trade Min. Deposit: 100€ License: Cysec |
|
72.30% of retail CFD accounts lose money
|

|
Platform: forextb Min. Deposit: 250€ License: Cysec |
|
|
Index
Zig Zag Indicator: meaning
The name helps to understand how this indicator is depicted, which is represented by a Zig Zag, that is a segmented line that is formed when the price movement exceeds a certain percentage.
To use it you have to set it in the trading platform, indicating some parameters that will outline the representation on the chart.
Below we can see an example of a Zig Zag indicator in the Metatrader 4 platform:
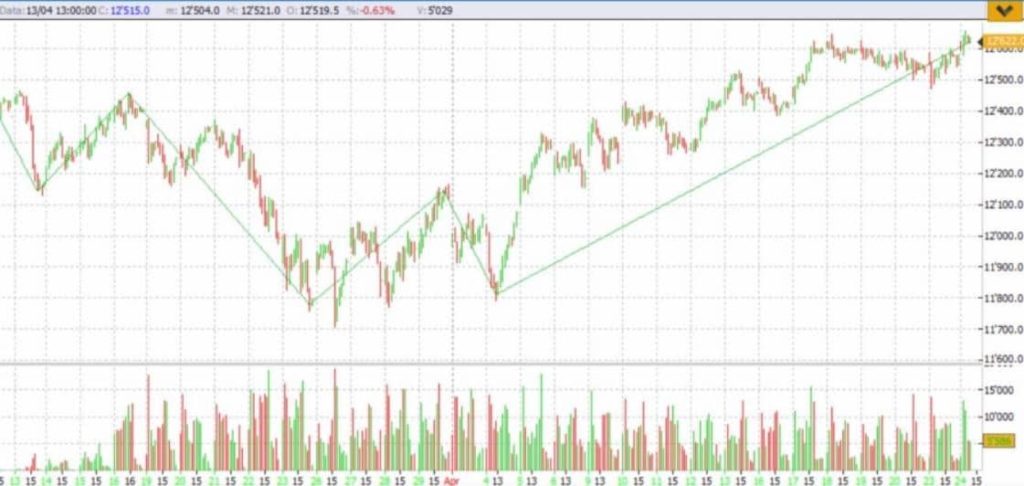
This chart shows a Zig Zag indicator set at 2.5% which clearly shows the directionality of the primary trend.
If we go to increase the deviation percentage, fewer points and fewer broken lines will appear. With a setting of 5% for example, increasing the size of the filter increases the number of movements that will not be taken into account by the indicator.
With a Zig Zag set to 5%, for example, we would probably see 2 or 3 lines in total in the same graph.
The movements that are filtered and excluded also depend on the time frame we are considering.
The Zig Zag indicator is not predictive but it only analyzes past data. Not only that, the last point is always in the formation phase, so the last line should not be considered because it can easily change based on recent price movements.
How to use Zig Zag Indicator
To make the most of the Zig Zag indicator you will need:
- A trading platform that supports it
- Learn more about its functioning mechanism
- A lot of practicing
As mentioned in the introduction, you can access the eToro Demo account and start testing what this indicator shows based on the setting you are going to give it.
Not only that, this online broker also allows you to learn how to use the best strategies based on the Zig Zag, copying what the most experienced traders do.
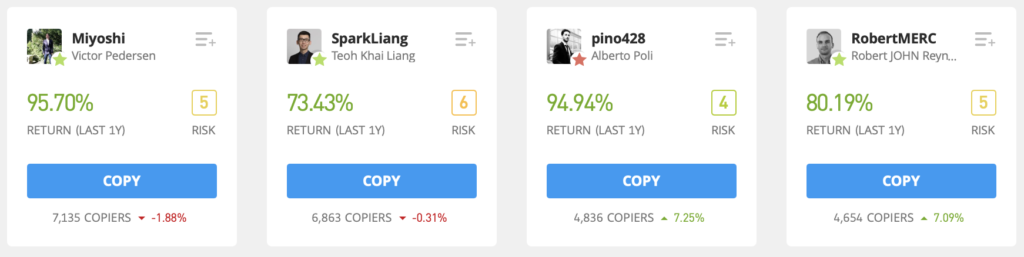
This possibility is based on Copy Trading, a patented tool by eToro, thanks to which you can choose the best traders who use this famous CFD Broker and with a click the software will copy all their market operations to your account, in proportion to how much you want to invest. .
So in addition to learning the most effective strategies, you will get the same returns as these experienced investors, here are some examples:
Along with Copy Trading and Demo tests, you will also need to improve your training and study some theory if you want to achieve constant and lasting results.
ForexTB, one of the most popular CFD Brokers in all of Europe has developed a Trading Course that will allow you to learn the basics of trading and the best strategies based on the Zig Zag indicator.
This ebook is full of details and is written in clear and very practical language, full of real examples.
In addition, ForexTB offers it for free despite having great value in terms of content.
Click here and download the Trading Course nowZig Zag Indicator advantages
The main advantages of the Zig Zag indicator are those of identifying the main trend of any asset being analyzed.
Of course, this tool is often associated with other indicators that can help make it more accurate and effective.
But this indicator also has other advantages, in addition to clearly showing a trend, it does the same with the classic figures of technical analysis, highlighting them as few other tools can do.
You can easily spot classic patterns such as Head and Shoulders, Double Top or Double Bottom, Joe Ross hooks and much more.
To make the most of the Zig Zag indicator, you can use the web platforms offered by various online brokers such as eToro and ForexTB or the famous Metatrader 4, made available for free by ForexTB, also in demo:
Click here and download the Metatrader 4 nowUses of Zig Zag Indicator
In addition to identifying the primary trend, the Zig Zag indicator is exploited for numerous purposes thanks to its great versatility, here are the main ones:
- Identify highs and lows
- Identify market entry points
- As a support for Fibonacci
- Identify the harmonic figures
- Highlight the technical analysis figures
- Finding Wolf Waves
- View the Keltner channels
Depending on the trader’s needs, Zig Zag can offer a clearer and simpler display mode, showing numerous details that would otherwise not be distinguishable on a classic Japanese candles chart.
Considering that the Zig Zag indicator only highlights significant price changes, to determine an entry level, it is often used together with other indicators or oscillators such as the ATR or the RSI.

Zig Zag Indicator setting
As we have already said, the Zig Zag indicator connects the maximums and minimums on a graph and the distance between these points must be equal to or greater than the percentage set on the indicator.
The default value for the Zig Zag is 5 but this percentage must be based on the type of asset being analyzed.
For example, for some low volatile indices 5% is too high a number and it is preferable to set the Zig Zag to 3.
Conversely, if you are trading in cryptocurrencies, which have extreme volatility, you can go as high as 10 or even more if you don’t want too many lines on the chart.
The default setting, in addition to the percentage, is based on the closing prices of each candle, but this setting can also be changed if necessary.
In addition, the “Depth” of intervention of the Zig Zag indicator must be set, ie the minimum number of candles that exceeds the starting candle by that famous percentage.
The Deviation instead is the number of pips after the formation of the previous minimum or maximum.
The last parameter is instead the “Backstep” which signals the minimum number of candles needed to draw a new Zig Zag segment.
The Zig Zag indicator does not always have all of these settings, it depends on the platform used, but it is necessary to set the most significant ones, adapting the tool to the market you are trading and also to the specific security.
Zig Zag Indicator strategies
Trading strategies based on the Zig Zag indicator usually also use another technical analysis tool to identify the entry points, or lines are drawn to help understand the chart.
The Zig Zag shows the highs and lows and this is great for drawing a channel within which prices move.
The simplest strategies are based on breaking these channels. But pay attention to false signals, the break must be very evident or confirmed by other indicators.
Often this indicator is underestimated for its apparent simplicity but you must not make this mistake, it is a really useful tool and can be exploited in many ways, let’s see some of them:
Fibonacci retracements
Fibonacci retracements are quite complex, especially in their setting. But the Zig Zag is very useful precisely for identifying the levels in which to set Fibonacci.
The Zig Zags are considered corrective waves and Fibonacci also has a wave structure, so the union of the two indicators strengthens the points shown by Fibonacci.
There is no single way to combine Fibonacci with Zig Zag, numerous trading strategies have been developed with these two tools, so you will have to do a lot of practice to find the one that best suits your style and needs.
For example, you can use Fibonacci levels with ZigZag waves by applying them on a single candle or on a trend reversal point.
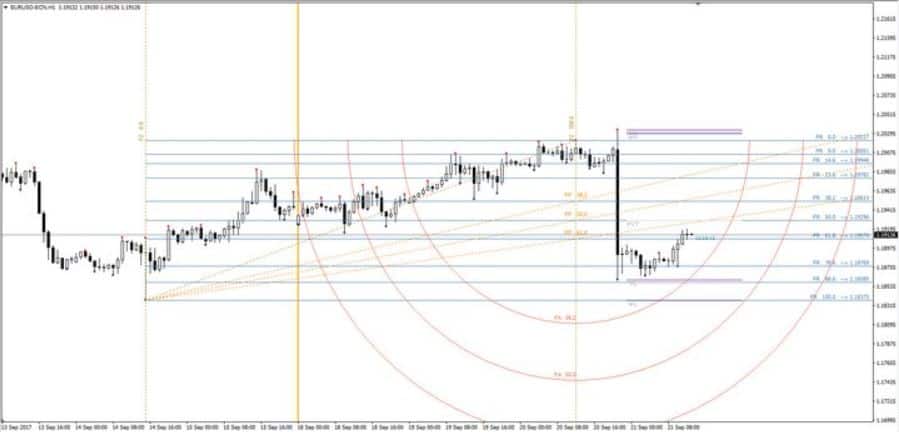
In the graph below you can clearly see how Fibonacci and Zig Zag have been set up to show and Fibonacci retracements, arcs and time periods:
Channels
Channels are the main feature of the Zig Zag indicator, which allows you to trace them manually or to use an additional tool dedicated to the channels.
The fact that an indicator shows channels does not mean that these are always respected by prices, so pay close attention, especially to false breakout signals, which are frequent in these cases.
To set up an effective strategy with the Zig Zag and channels, you need to do many tests in order to find the right combination for the asset you want to trade.
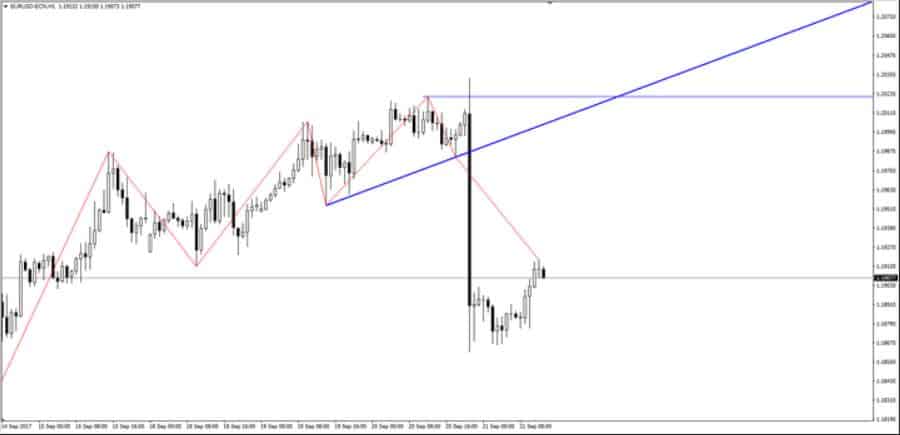
The graph below clearly shows both strengths and weaknesses of the Zig Zag, the bearish black candle in fact, before breaking the channel highlighted with the sloping blue line, breaks the absolute maximum upwards showing a clear example of a “false break”.
In addition to the channels, the Zig Zag often highlights the more classic configurations such as the W (or double bottom), the M (or double top), the cup with handle; and many others.
Traders who are familiar with these patterns find a tool such as the Zig Zag indispensable, which highlights them clearly and simply, without dirtying the chart with overly “invasive” indicators.
Often some of these figures are crystal clear once the Zig Zag made them stand out but they weren’t as visible without this indicator.
Multiple Zig Zags
The Zig Zag indicator can also be used multiple times in a single chart, applying different settings to each of them.
The multiple Zig Zag is used to filter the “background noise” differently and have a clear view of the main trend but to be able to enter the market without too much delay thanks to the indications of the Zig Zag with a lower percentage.
Below we can see a trading strategy based on 2 Zig Zag. The blue one is set with a rather high percentage and only indicates the direction of the primary trend.
The red one, on the other hand, set to a much lower percentage, clearly shows entry points, identified by the intersection or approach of the red line with the blue one that acts as a resistance or support.
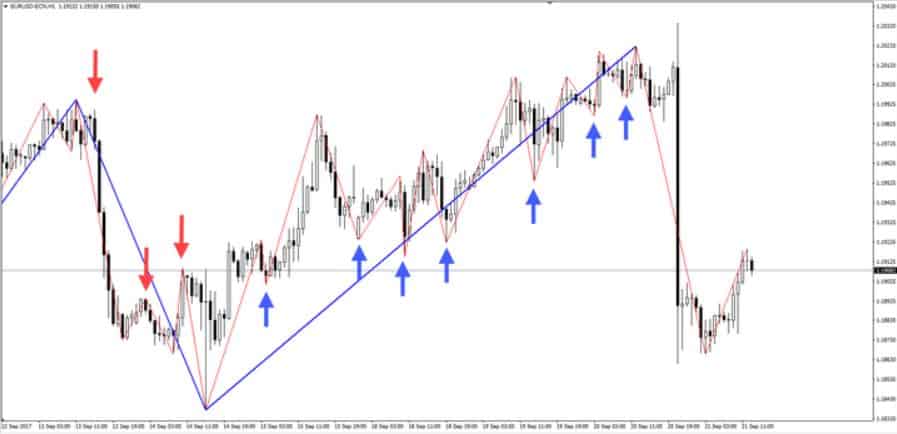
In the case shown in this example the deviation of the blue Zig Zag is fixed at 36, while that of the red is fixed at 6.
These settings are not fixed, they must be studied based on the asset and price volatility.
Conclusions
In this detailed guide we have shown what the Zig Zag indicator is, how it should be set and what it highlights on a graph.
We also wanted to investigate some of the most common strategies that exploit this indicator, often together with other technical analysis indicators.
It is essential to remember that Zig Zag is not predictive but only analyzes the past, so it should be used with extreme care when classic breakouts occur.
This indicator always shows an ongoing trend very clearly, but it is useless if the market is not in trend but for example moves sideways.
If you want to deepen the basics of technical analysis and learn how to set the Zig Zag indicator, we recommend that you download the ForexTB Trading Course, it is free and very complete, here is the link:
Click here and download the Trading Course for freeIn addition to theory, you also need to practice and for this there is the eToro Demo account, free and unlimited:
Click here to access the Demo account for freeIt is a technical analysis tool that helps identify an ongoing trend.
It has several settings but the most important is the deviation percentage which indicates how much a price must vary from the previous one for a line to be drawn.
Yes, it is an indicator included in the main trading platforms.
Better to use a Demo account like eToro’s to test this indicator without taking any risks.