
Forex Charts [Best Platforms]
All of you may have seen Forex Charts that show the trend of a certain currency pair, but these charts are not just a “visual” representation of the prices of a stock, they have some peculiarities that deserve further study.
In this guide we will see how to access the best Forex charts for free by following these steps:
- Register and work with a regulated and secure Forex Broker
- Practice on the Demo account to familiarize yourself with the Forex platform and Charts
- Make the minimum deposit required and you have access to the real market
By following these steps you can invest in the currency market without paying commissions and access the best Forex charts safely.
In fact, thanks to online brokers such as eToro, it is possible to trade on the currency market using the precision of Forex charts in real time. Here are the best platforms available:

|
Platform: etoro Min. Deposit: 50€ License: Cysec |
|
|
|---|---|---|---|

|
Platform: xtb Min. Deposit: 100€ License: Cysec |
|
|

|
Platform: iqoption Min. Deposit: 50€ License: Cysec |
|
|

|
Platform: ubrokers Min. Deposit: 250€ License: Cysec |
|
|

|
Platform: trade Min. Deposit: 100€ License: Cysec |
|
72.30% of retail CFD accounts lose money
|

|
Platform: forextb Min. Deposit: 250€ License: Cysec |
|
|
Index
Forex Charts: What are them?
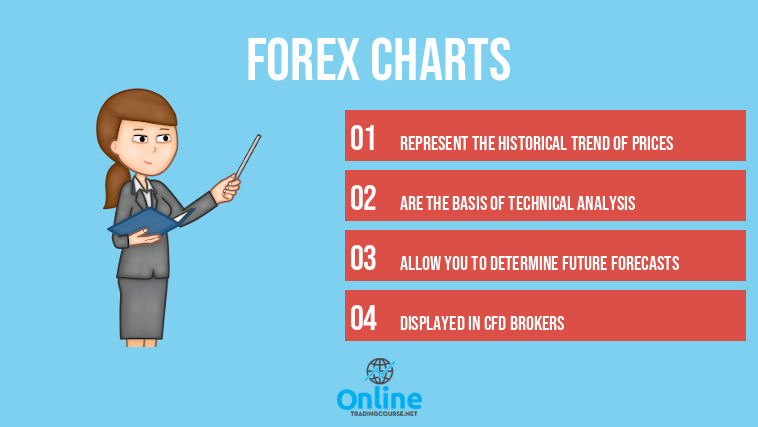
Forex charts graphically represent the historical behavior, in different time frames (time frames), of the price changes of a currency pair of the Forex market.
Charts are a feature that underlies technical analysis and allow you to have an immediate picture of the performance of a stock, whether it is Forex, Stocks, Indexes, Commodities, etc.
Thanks to a Forex chart, a trader has the ability to visualize the past of a currency pair and this allows, according to various theories, to predict the future price trend.
The most common Forex charts are line, bar and candlestick charts, depending on how the Forex quotes are displayed.
Real Time charts
Real-time Forex charts allow you to evaluate the performance of a currency pair “live” and are usually available on every online broker.
Below we show, as an example, the real-time quote of the EUR / USD pair:
How to find the best Forex Charts
Charts are available on every trading platform but obviously the software are not all the same and to find the best Forex charts it is necessary to select the Brokers with the best platforms on the market.
To help you select these platforms, we advise you to verify that the brokers examined have these essential characteristics:
- They have to offer CFDs, contracts that allow you to trade on any currency pair
- They don’t have to charge commissions
- They must have at least one license issued by CONSOB or CySEC
- They must use a trading platform with international assistance
CFDs are contracts (for difference) that allow you to trade on any security, not just in the Forex market.
Once you have chosen the platform you prefer, you can view the relevant chart and buy or view a Forex pair in this way:
- Buy the CFD of the Forex pair you are interested in to earn if prices rise
- Sell the CFD of the Forex pair you are interested in to profit if prices fall
When the price reaches the desired quotation, close the transaction and collect any net profits, without commissions.
Where are the best Forex charts?
But how do you go about choosing the platforms that offer the best charts on the market?
To make an accurate selection it is necessary to test the Forex Trading platforms, evaluate the charts available, the customization possibilities, the tools and indicators included in the software made available by the CFD Broker.
OnlineTradingCourse.net saves you this “effort” because it has already carried out this analysis for you and believes that the CFD Brokers with the best Forex charts on the market are eToro, ForexTB and IQ Option, let’s see why:
eToro: Copytrading without using forex charts
eToro has reached an unparalleled level of diffusion on the markets, surpassing the 10 million users registered on its platform, considered one of the most intuitive and simple to use.
But the fame of this CFD Broker does not derive only from the platform and the undoubted reliability, also confirmed by the CONSOB and CySec license it is provided with; but from a patented automatic investment system: Copy Trading.
Thanks to Copy Trading it is not necessary to study the charts, in fact you can copy the market operations of the best traders in the world (on eToro) automatically and for free.
These expert traders will study the charts and operate for you, you will only have to choose the ones you think are best, following these steps:
- Register on eToro
- In the “People” section, choose the traders to copy, based on how much they earn
- With a click, Copy Trading will copy the operations of the chosen traders into your account
At that point you will get the same returns as these trading experts (in proportion to the investment made), at no additional cost.
Do you want to know how much you earn with Copy Trading? It depends on which traders you will copy! Below we show you last year’s returns from some of these seasoned investors:

Before investing money in Copy Trading, you can test it on the free Demo account, where there is no risk, because in Demo the money is virtual.
Click here to sign up for freeFor more details you can read our full eToro review.
ForexTB: forex charts course
ForexTB has made its way among online brokers with a different approach than other financial intermediaries, in fact ForexTB has staked everything on the support and training of its traders.
The Forex charts made available by this Broker, authorized by CySEC, are those provided by two trading platforms, which can be chosen and used for free:
- Metatrader 4 is a platform with numerous tools available, which meets the needs of the most experienced traders.
- The web platform is simple and accessible from any browser, without making any downloads.
To learn how to best use the Forex charts available on the trading platforms, ForexTB has created a totally free Trading Course that explains the basics of technical analysis, the operation of the charts and the tools connected to them.
Click here and download the Trading Course for freeThis Broker also offers real operational support to take advantage of Forex charts: Send free Trading Signals processed by Trading Central to all investors. These are indications with a success rate of over 70% and can be obtained for free by following the link below:
Click here to get free trading signalsRead our ForexTB review for more information.
IQ Option: forex charts with €10 deposit
IQ Option has intercepted one of the limits that some novice traders often encountered: the minimum deposit required to open a real trading account.
With IQ Option this limit is easily overcome, in fact with only 10 Euros you can open a real account and negotiate even a few Euros on each operation.
The IQ Option platform is very clear, complete and simple to use and the Forex charts available to users are extremely customizable.
Try the IQ Option platform for freeThe security of this Broker is guaranteed by CONSOB and CySec, the Forex charts are also available on the Demo account, in this way you can learn how to use them even without paying those famous 10 Euros necessary to open a real account.
Click here and access the IQ Option Demo account for freeTo better study Forex charts, IQ Option offers a training area full of free content, essential for learning the secrets of technical analysis.
Click here to register on IQ Option (official link)If you want to know more, you can read our full review on IQ Option.
Forex Charts: How do they Work?
Forex charts in practice show the past of a currency pair and according to technical analysis can help predict the future as well.
The trading platforms we have talked about provide very precise software, based on real data deriving from the history of a given Forex pair.
To use technical analysis and study a Forex strategy that allows you to obtain appreciable results, you cannot do without charts which, compared to “raw” data, offer a clear view of the past performance of a stock.
Traders who use technical analysis to invest in Forex believe that short-term price movements are the result of supply and demand forces in the market. Therefore, for technical traders, the fundamentals of the asset are less relevant than the movements generated by the constant struggle between buyers and sellers.
As we mentioned, the most common charts are line, bar and candlestick (Japanese) charts. Most charting software in one platform provides all the historical data of the major Forex currencies and allows you to customize the charts in any way.
A typical forex chart will show the time period on the X axis and the exchange rate on the Y axis.
Line forex chart
A line chart is the simplest chart and is formed by drawing a line from one closing price to the next.
When all the closing prices are added to create the line, we can see a general picture of the price movement. This form of graph is simple, but some very important information is lost and for this reason it is rarely used in technical analysis.

Bar forex chart
A bar chart is a step up from the line chart by adding some basic information.
The “bar” shows the opening price to the left of the bar, the low, the high and the closing price to the right of the bar.
In a given timeframe, the bar chart shows a lot of information and makes technical price analysis much easier.

Candlestick forex chart
The Japanese candlestick chart is the most used in technical analysis, because it adds the “color” to the bar chart which helps a lot to understand if a particular “candle” is bullish or bearish.
In addition to the bar chart information; the maximum, the minimum, the opening and closing, the body of the candle immediately shows the direction of the price in that period of time.
In the chart below the white candles are the bullish ones, while the black ones are bearish. The “wicks” of the candles show the distance between the entry and exit prices; and the highs and lows in that time frame.

Forex charts with technical indicators
Forex charts are highly customizable and allow you to add other Trading Indicators to the simple price chart that help you understand how a certain currency pair has moved.
There are two basic types of technical indicators in Forex charts:
- Overlay Indicators: These indicators follow the price by drawing “lines” directly on the price chart. Some of these are for example the Moving Averages and the Bollinger Bands.
- Oscillators: These are technical indicators that oscillate between a minimum and a maximum and draw a separate chart from that of prices. Examples include MACD and RSI.
The trading platforms we have seen, provided by the best Forex brokers on the market, allow for considerable customization of the charts, through settings, colors and indicators that help to correctly analyze price trends and make more accurate future predictions.
Conclusions
In this guide we have seen what Forex charts are, what characteristics they have and how to choose the best online brokers to access the most detailed charts.
The platforms provided by brokers usually provide a Demo account, which is ideal for practicing with charts without taking any risks.
After having done your tests in Demo you can make the minimum deposit required by the chosen Broker and move on to trading with real money, much more interesting.
Here are the official links of the free Demo accounts offered by the best Forex brokers:
- Access the eToro Demo account for free by clicking here
- Register on ForexTB and try the Demo account by clicking here
- Access the IQ Option Demo account for free with this link
They are the representation of the historical price trend of a currency pair.
They are based on software with historical data from a currency pair that can be shown on a line, bar or candlestick chart.
To choose the best platforms for Forex charts you need to choose safe and regulated online brokers.
CFD brokers like eToro offer the best Forex charts on the market.
